mbed Fitness Tracker
Group Members
- Molly Emig
- Haoyu Xiong
- David Yu
Introduction
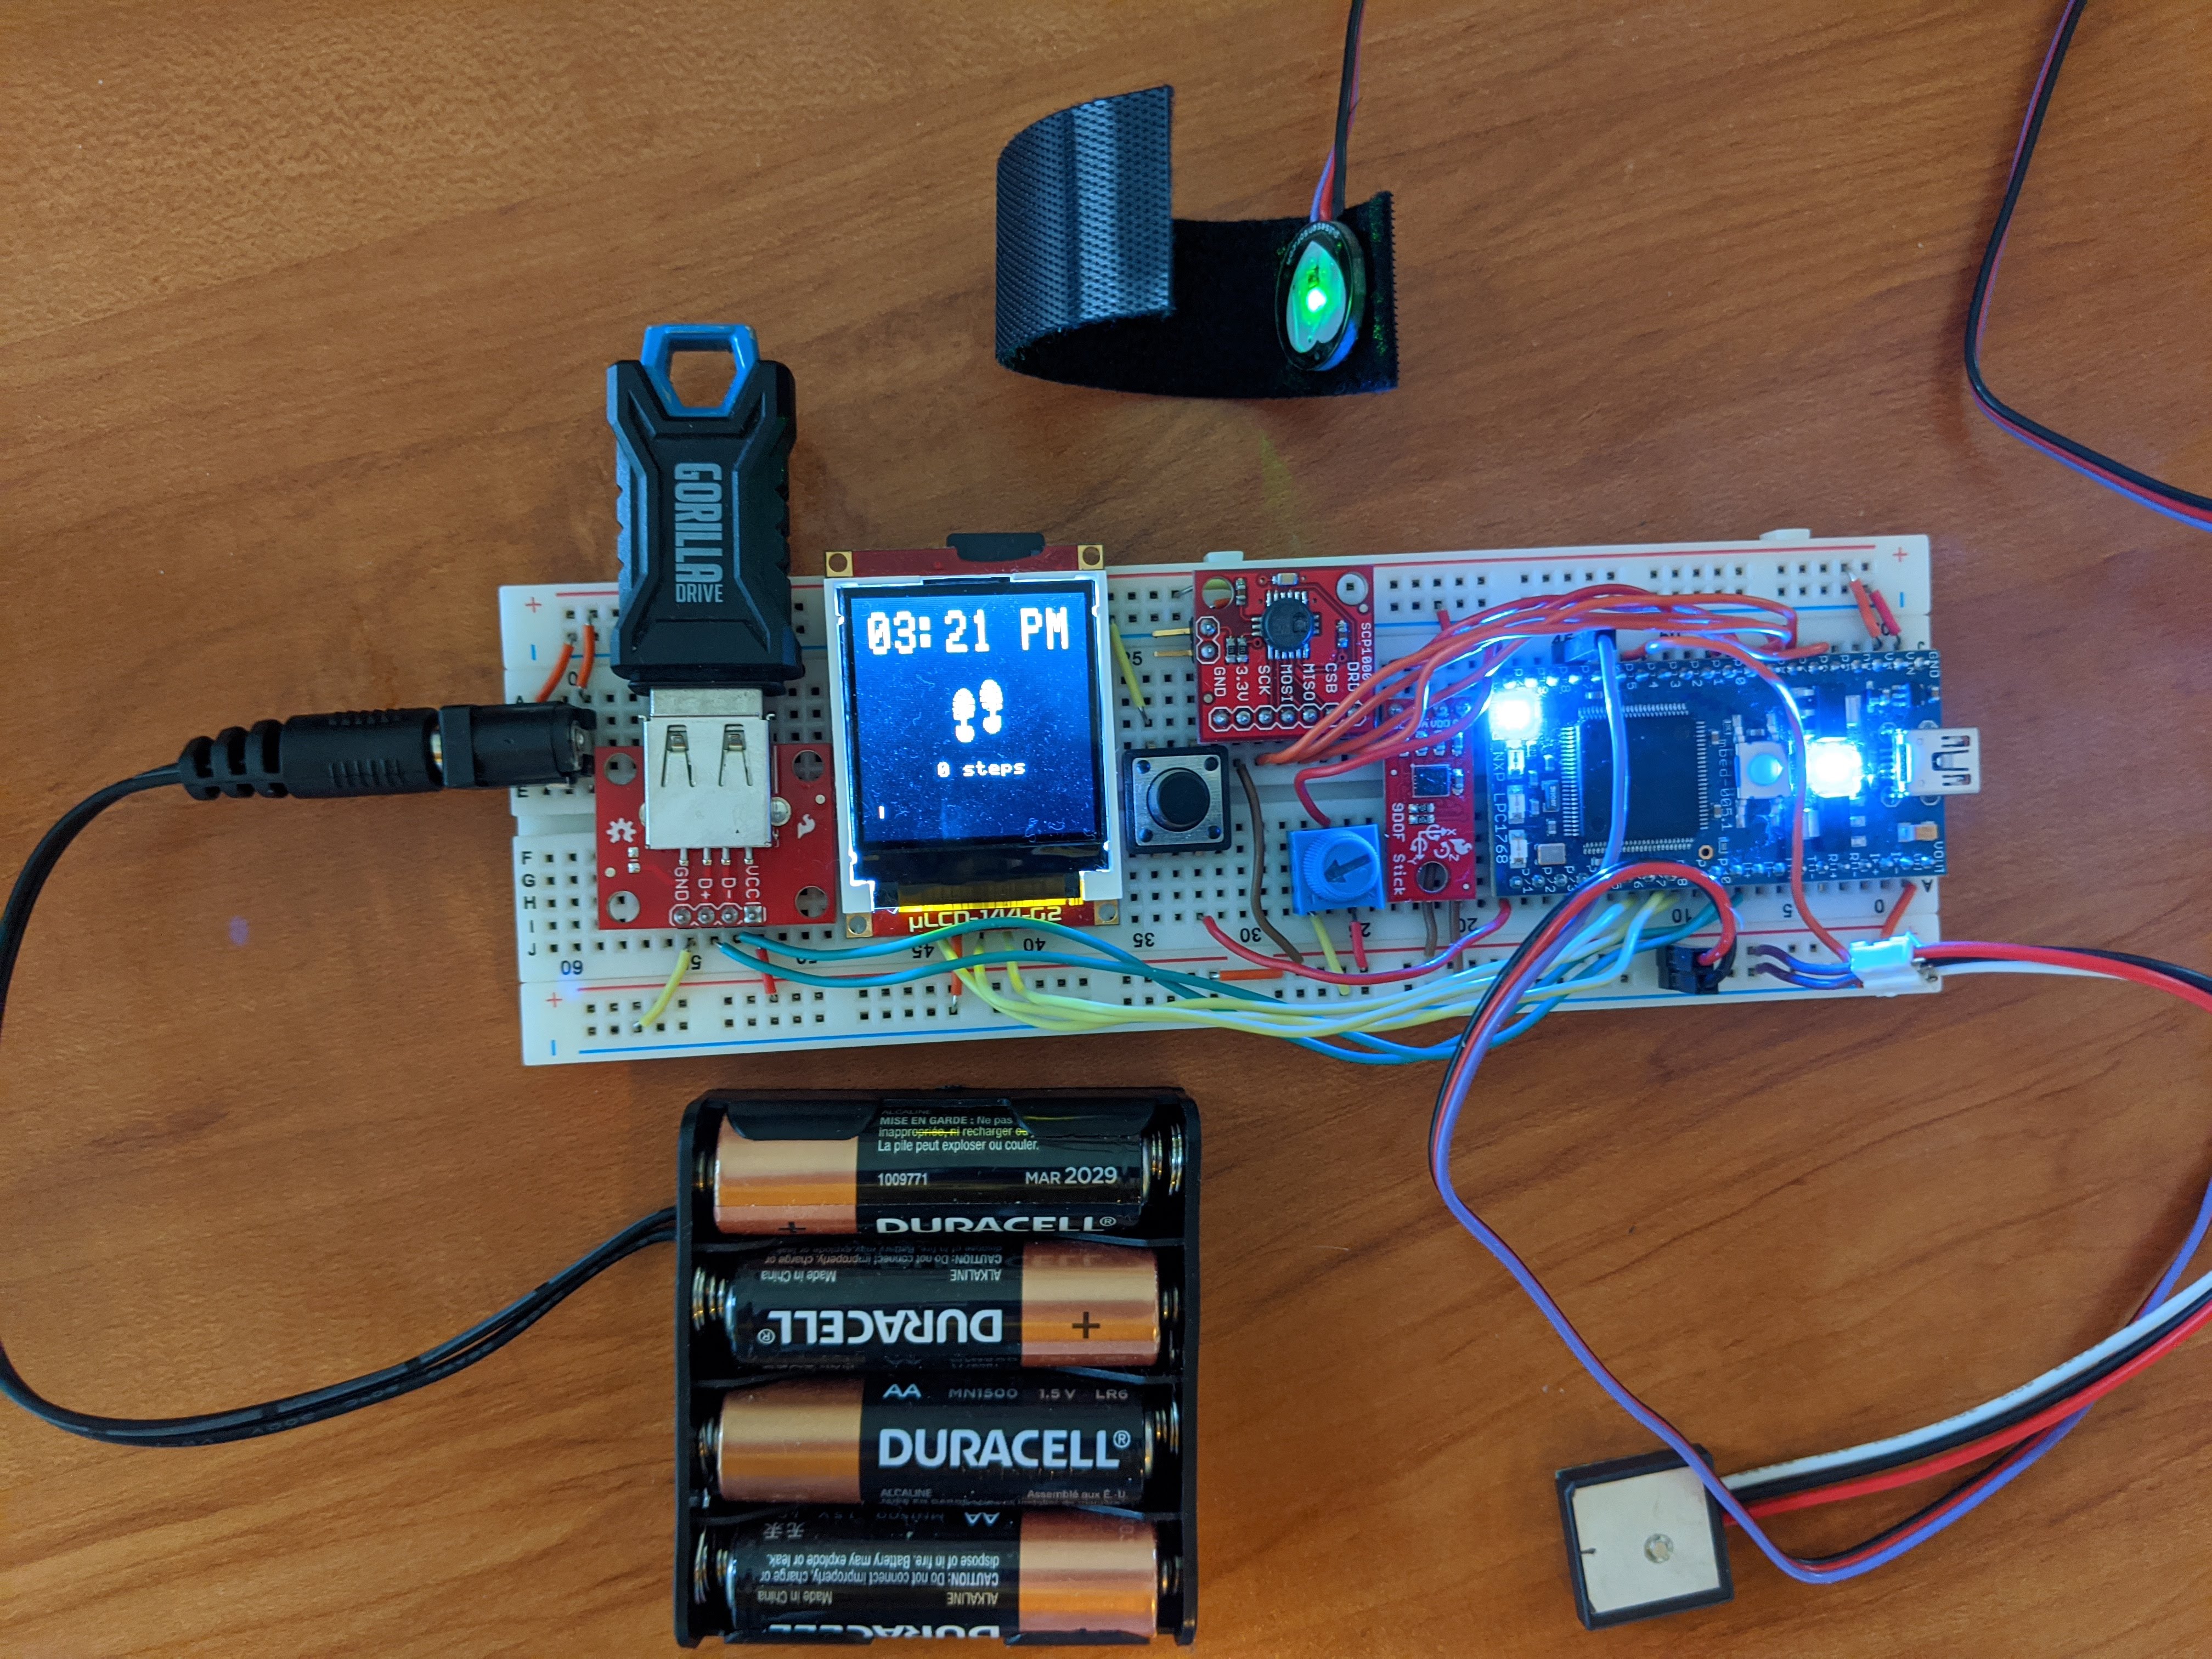
The mbed Fitness Tracker is a feature-packed wearable fitness tracker. It uses a variety of sensors to monitor steps, heart rate, floors climbed, calories burned, and distance traveled. The mbed LPC1768 is the main microcontroller running the operations of the device using RTOS. A LSM9DS1-IMU, specifically it's triple-axis accelerometer, is used to count the number of steps. The IMU uses I2C to interface with mbed and stream over acceleration data. A PPG Pulse sensor is used to monitor the user's current heart rate. To monitor floors climbed, an SCP1000 Pressure Sensor is used to measure changes in pressure which correspond with elevation changes. A GP-20U7 GPS Receiver tracks the user's current location and also measures the distance traveled. Lastly, a simple user-friendly UI is displayed on a uLCD-144-G2 which shows all the activity data.
A USB flash drive is used to save the user's configuration, current fitness data, and data for the past week in the form of text files. A GUI created using Visual Studio and C# is used to help the user visualize their fitness activity for the week. With a simple USB connection between mbed and PC, daily activity data stored in a text file is sent from mbed to the PC using serial. The GUI then graphs the steps, floors climbed, calories burned, and distance traveled in a bar chart so the user can easily view their activity over the course of a week.
Parts List
- 1 x mbed LPC1768
- 1 x LSM9DS1-IMU
- 1 x SCP1000 Pressure Sensor
- 1 x 4D Systems uLCD-144-G2
- 1 x GP-20U7 GPS Receiver
- 1 x PPG Pulse Sensor
- 1 x USB Breakout
- 1 x Pushbutton Switch
- 1 x 10K Ohm Potentiometer
- 1 x DC Barrel Jack Adapter
- 1 x Battery Holder
- 4 x AA Battery
- 1 x USB Flash Drive
- 1 x Micro SD Card
Wiring
| Mbed | LSM9DS1-IMU |
|---|---|
| p10 | SCL |
| p9 | SDA |
| 3.3V (Vout) | VDD |
| GND | GND |
| Mbed | SCP1000 |
|---|---|
| - | DRDY |
| p8 | CSB |
| p6 | MISO |
| p5 | MOSI |
| p7 | SCK |
| 3.3V (Vout) | 3.3V |
| GND | GND |
| Mbed | uLCD | |
|---|---|---|
| - | +5V | Battery Power Supply |
| p27 | TX | |
| p28 | RX | |
| GND | GND | |
| p29 | RES |
| Mbed | GP-20U7 |
|---|---|
| p14 | TX (white) |
| 3.3V (Vout) | VCC (red) |
| GND | GND (black) |
| Mbed | Pulse Sensor |
|---|---|
| p17 | Signal (purple) |
| 3.3V (Vout) | VCC (red) |
| GND | GND (black) |
| Mbed | USB Breakout |
|---|---|
| 3.3V (Vout) | VCC |
| D- | D- |
| D+ | D+ |
| GND | GND |
Block Diagram

Setup
- Connect all the components according to the pinouts in the Wiring section
- Import and compile the mbed program in the Source Code section
- Download and unzip the PC GUI Visual Studio Project (make sure to have Visual Studio on personal computer)
- Download and unzip folder of icons used for LCD screen
- Convert the icon images and store them in the uSD card in RAW format using Graphics Composer in the 4D Systems IDE
Information
Use this link for instructions on using Graphics Composer (it's an archived pdf so click on any of the dates that appear): https://web.archive.org/web/*/http://www.4dsystems.com.au/downloads/Application-Notes/4D-AN-G5002-Serial-Displaying-Image-Video-Animation-Goldelox-REV1.pdf
Make sure to adjust the sector address values to match what's in the mbed program.
Another link that might be helpful: https://os.mbed.com/users/4180_1/notebook/ulcd-144-g2-128-by-128-color-lcd/
- Place uSD card into the slot on the LCD
- Insert the USB flash drive into the breakout board
- Run the mbed program on mbed and it should be ready to go
- For the PC GUI, connect PC to mbed using the same USB cable for programming
Warning
If the uSD card is not inserted into the LCD screen, the program will not run smoothly. The uSD card does not actually need to have the icons stored in it if it is too much of a hassle to convert the images to RAW, but the card must be in the LCD screen slot as the code is trying to read it.
Source Code
Import program4180_Fitness_Tracker
This is a repository for code relating to mbed Fitness Tracker
Last commit 28 Apr 2020 by  ECE 4180 Fitbit Project
Note
Below are the zip files for the icons displayed on the LCD screen and the Visual Studio project containing the GUI. The files have been renamed to .bin files in order to able to insert in this wiki. When downloaded, please rename the files/change file extension to .zip.
icons.bin
mbed_fitness_tracker_gui.bin
Algorithms
Counting Steps
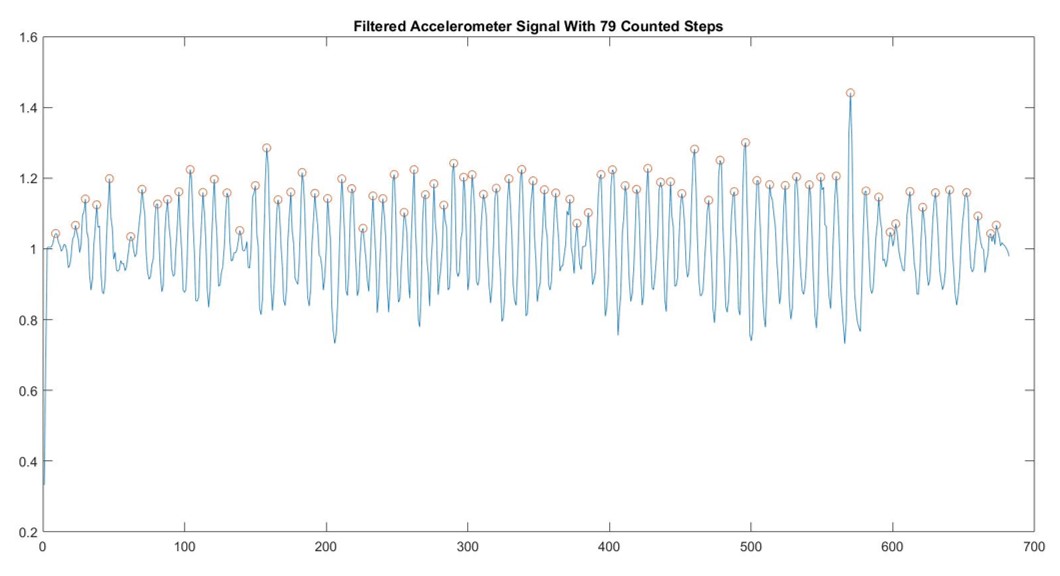
Our step counting algorithm consisted of reading the x, y and z components of acceleration from the IMU and taking the magnitude of this acceleration vector to find the overall acceleration of the person. We then applied a low pass filter to smooth out the signal and remove high frequency noise outside the typical bandwidth of human movement (1). Specifically, we used a three point moving average filter because its computation simplicity made it ideal for real time computation.

Based on experimental IMU data that we collected and analyzed in MATLAB, we decided to count a step as any point that was a peak with a minimum prominence of 0.03 (greater than the point before it and after it by more than 0.03). We found that this method resulted in a step count comparable to a manual count.
Counting Flights of Stairs
Our algorithm for counting flights of stairs was also developed using experimenting data collected with the barometric pressure sensor and analyzed in MATLAB. We started out sampling the pressure sensor at 5 Hz and saw a clear increase in pressure when going down the stairs and a corresponding decreasing in pressure when going up the stairs.
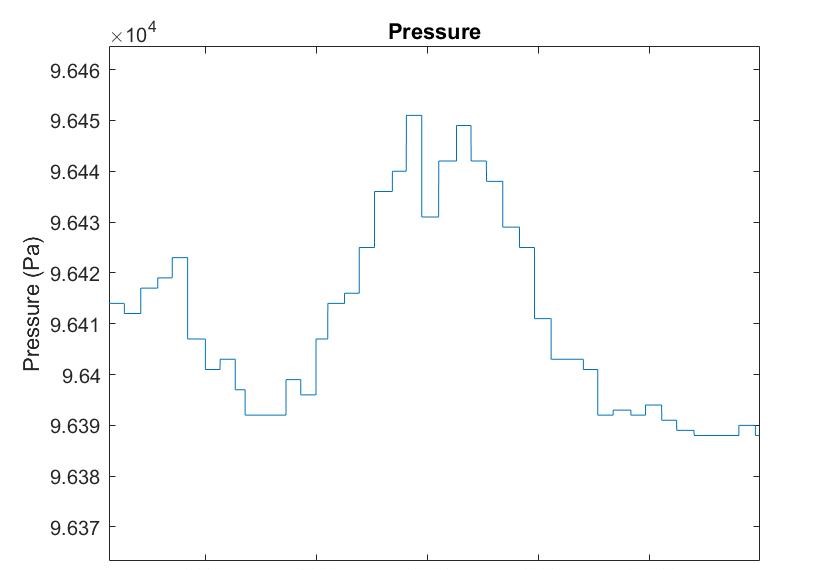
However, this change in pressure occurred over approximately 500 data points, which is an unreasonable amount of data to store for tracking pressure data in real time. For this reason, we decreased our sampling rate to 0.5 Hz and were able to accurately count flights of stairs by storing a four point buffer of previous pressure values and counting changes in pressure greater than 40 Pa. With this short data buffer, we also improved the accuracy of our stair counting algorithm by not allowing it to count multiple flights of stairs within six seconds of each other.
Measuring Distance Traveled
We measured distance traveled using latitude and longitude values sampled from the GPS receiver at a rate of 0.1 Hz. We then used the haversine formula, which calculates the shortest distance over the earth's surface between two points, to measure the distance traveled in miles. (2).

Where phi is latitude, lambda is longitude, and R is the radius of the earth (3,959 miles).
An alternative distance algorithm is included in the program in the case that the GPS is not outputting accurate results or the user does not have the sensor. The algorithm is commented out and can be re-implemented. It estimates the user's stride length in real time and distance is simply determined by steps * stride_length. The formula for stride length was from this paper (4) and is shown below .

L is the stride length, K is a personalized parameter determined by trial and error (equal to 0.55 in the program), and Acc-vmax and Acc-vmin are the maximum and minimum magnitudes of the vertical acceleration in a stride (set to max and min of the Z acceleration vector in the program).
Estimating Calories Burned
We estimated calories burned using the heart rate sampled from the pulse sensor at a rate of 2 Hz and the user's gender, weight and age entered during the setup mode. We then used the following formula for calorie calculation (3).

Where G represents the gender and is 1 for males and 0 for females, HR is the heart rate in beats per minute, W is the weight in kilograms, A is the age in years and E is the energy expenditure in calories per half second.
Setup and Runtime Modes
On startup, the mbed Fitness Tracker will display a series of screens where the user will input their gender, age, weight, and daily step goal. The user-related data will be stored in a configuration text file (config.txt). The gender, age, and weight are necessary for determining calories burned and the step goal is for the progress bar. The first screen that will be displayed on the LCD on startup is the use previous configuration screen. The user can choose to use the previously stored configuration or create a new one. By selecting to use the previously stored configuration, the age, weight, gender, and step goal stored in config.txt will be loaded along with the last stored activity data (steps, floors climbed, distance traveled, calories burned) in data.txt. After those are loaded, the rest of the setup screens are skipped and mbed Fitness Tracker will go directly to displaying real time activity data. If the user creates a new configuration, then a series of screens will appear and the user can enter in the data using a potentiometer to adjust the values and confirm the entry with the pushbutton which moves on to the next screen. Once setup is finished, the user's new configuration is automatically saved in config.txt
Note
If config.txt does not exist or it is empty and the user selects yes to use previous configuration, the program will go back to the use previous configuration screen. The user must enter a new configuration.
After the setup screens, the sensors are activated and data measurements from the sensors will be ongoing in separate threads. The LCD will display real time activity data from the sensors along with the current time from mbed's Real Time Clock. Using a potentiometer, the user can switch between displaying steps, heart rate, floors climbed, calories burned, and distance traveled. Each of those statistics has a dedicated screen and icon which are displayed based on the pot reading. The steps screen has a progress bar on the bottom that indicates how close the user is to reaching their step goal.
Serial Communication and Data Storage
All of the data used in this Fitness tracker is stored in the USB drive connected to mbed. There are three files in the USB directory, the “config.txt” file which stores the previous user defined configuration information, the “data.txt” file which stores and updates the current fitness data information every minute, and finally the “prev_data.txt” file which stores the summary of the fitness data over the past 7 days. The fitness information for a day – date, steps, flights, calories and distance – is stored in one line separated by tabs to be conveniently partitioned during the mbed-to-PC serial communication processes. If a change in day is detected (date changes), then the current data will be appended to "prev_data.txt" and the current data will be reset to 0.
In order to trigger the serial communication procedure, a predefined command string “!p” is being constantly checked on mbed over the virtual serial port. When the “load” button is clicked in the PC GUI, the computer sends the string over to mbed via the virtual serial port. Then mbed streams through all the information stored in the “prev_data.txt” file on the USB drive to the PC using the serial printf command.
C# Graphical User Interface
The mbed Fitness Tracker Data Visualizer is a GUI created in C# using Visual Studio. It reads in the past week fitness data in prev_data.txt and graphs the data in bar chart form. Each data is plotted on its own plot and has the x-axis as the date. The user has to connect mbed to the PC using a USB cable and use the GUI to select the correct COM port for mbed. Once connected, the user presses the load button to stream in the data and plot it. The user can then select which data to be viewed with the buttons on the left.
![]()
Warning
Do not connect the GUI to mbed while the fitness tracker is in the setup mode (asking for previous configuration, age, weight, etc.). During setup, the USB drive is initialized and sends multiple messages through serial that will be picked up by the GUI if it is connected to mbed.
Video Demo
Video Presentation
References
(1) A. Mannini et al., “Activity recognition using a single accelerometer placed at the wrist or ankle”, Medicine & Science in Sports & Exercise, vol. 45, no. 11, pp. 2193-2203, Nov, 2013, doi: 10.1249/MSS.0b013e31829736d6
(2) C. Veness, "Calculate distance, bearing and more between Latitude/Longitude points", Movable Type Scripts, [Online]. Available: https://www.movable-type.co.uk/scripts/latlong.html. [Accessed: 27-Apr-2020].
(3) L. Dugas et al., "Prediction of energy expenditure from heart rate monitoring during submaximal exercise", Journal of Sports Sciences, vol. 23, no. 3, pp. 289-297, Mar, 2005, doi: 10.1080/02640410470001730089
(4) H. Xing, J. Li, B. Hou, Y. Zhang, and M. Guo, “Pedestrian Stride Length Estimation from IMU Measurements and ANN Based Algorithm,” Journal of Sensors, vol. 2017, pp. 1–10, Feb. 2017.
Please log in to post comments.
mbed Fitness Tracker
Wiki Page for the mbed Fitness Tracker created by Molly Emig, Haoyu Xiong, and David Yu
Page owner:  David Yu
Created 28 Apr 2020.
Last updated 29 Apr 2020